
The TDS Receivable Trap: Why Waiting for Form 26AS Is Costing Your Cash Flow
August 25, 2026How Do You Migrate from Tally to NetSuite Without Disrupting Finance Operations?
September 7, 2026Executive Summary
AR Automation KPIs reveal whether accounts receivable problems originate from customer behaviour, process delays, fragmented data or excessive manual work. Rising DSO, overdue receivables, unapplied cash and slow dispute resolution are not merely collection issues—they indicate weak invoice-to-cash scalability. By evaluating ten critical Accounts Receivable KPIs, CFOs can assess automation readiness, identify working capital trapped in AR and build a measurable business case for AI-powered accounts receivable automation.
Is Your AR Team Busy or Effective?
An AR team may send hundreds of reminders, make daily collection calls and maintain detailed spreadsheets yet still struggle to improve cash flow.
Activity does not always translate into outcomes.
For CFOs and Controllers, the important question is not how busy the collection team appears. It is whether the existing AR operating model can:
- Scale as invoices and customers increase
- Prioritize the accounts most likely to delay payment
- Prevent invoices from becoming overdue
- Apply incoming cash accurately and quickly
- Identify and route disputes
- Maintain reliable customer balances
- Forecast collections with confidence
- Improve performance without proportionately adding headcount
This is where AR Automation KPIs become important.
The right metrics do more than evaluate accounts receivable performance. They reveal which parts of the process are constrained by manual work, poor integration, inconsistent follow-up or inadequate decision support.
An AR team is ready for automation when its performance problems are systematic and repeatable—not simply the result of one unusual customer or temporary business event.
What Does AR Automation Readiness Mean?
AR automation readiness does not mean that every process is already standardized or that every customer behaves predictably.
It means the organization has:
- A measurable AR performance problem or scalability constraint
- Sufficient invoice, payment and customer data to identify patterns
- Repeatable processes that can be automated
- Management commitment to improve invoice-to-cash outcomes
- A clear baseline against which automation results can be measured
From a CFO’s perspective, readiness is less about technology and more about economics.
If DSO is increasing, cash remains unapplied, disputes are aging and collection costs rise with revenue, the company is absorbing a growing working capital penalty. Continuing to add people may address immediate workload but rarely fixes the underlying process.
AR Automation becomes strategically relevant when the organization needs to collect faster, improve control and scale without creating a corresponding increase in finance operating costs.
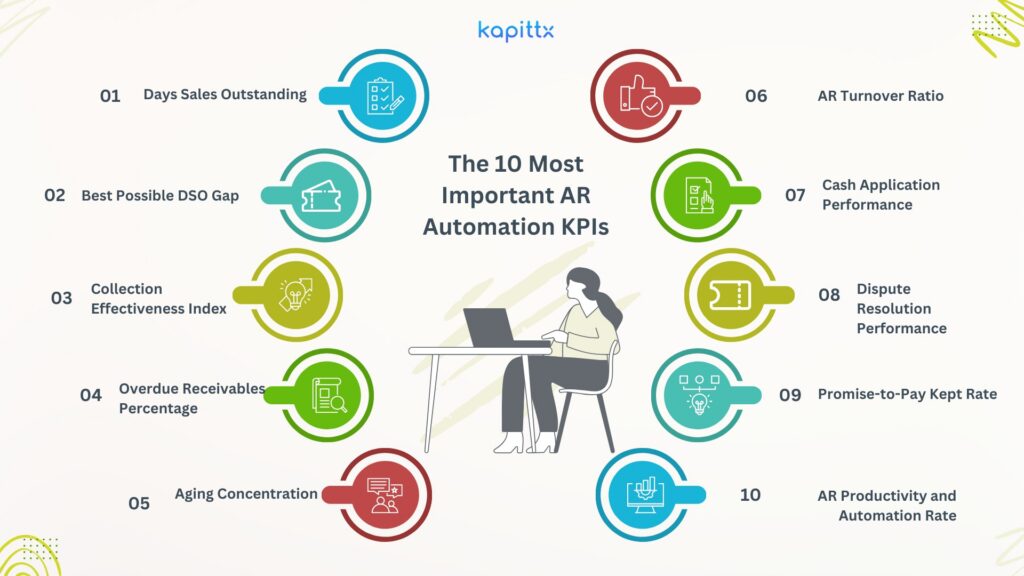
The 10 Most Important AR Automation KPIs
| KPI | What it measures | Automation warning signal |
| 1. Days Sales Outstanding | Average time to collect receivables | DSO rises or remains above agreed payment terms |
| 2. Best Possible DSO Gap | Delay beyond the current receivables position | Actual DSO increasingly exceeds best possible DSO |
| 3. Collection Effectiveness Index | How much collectible AR was actually collected | Collection effectiveness falls despite high team activity |
| 4. Overdue Receivables Percentage | Share of open AR past due | Overdue balances grow faster than sales |
| 5. Aging Concentration | Value trapped in older aging buckets | More balances move into 60-, 90- or 120-day buckets |
| 6. AR Turnover Ratio | How efficiently receivables convert into cash | Turnover declines over successive periods |
| 7. Cash Application Performance | Speed and accuracy of payment posting | High unapplied cash or slow posting cycles |
| 8. Dispute Resolution Performance | Value and time tied up in disputes | Disputes age without ownership or resolution |
| 9. Promise-to-Pay Kept Rate | Reliability of customer payment commitments | Broken promises are not identified or escalated |
| 10. AR Productivity and Automation Rate | Output achieved per collector and level of manual effort | Workload and headcount rise proportionately with volume |
These Accounts Receivable Metrics should be examined as connected indicators. No single number determines automation readiness.
1. Days Sales Outstanding
Days Sales Outstanding measures the average number of days required to collect receivables. SAP describes DSO as the average time a company takes to collect amounts owed by customers.
A commonly used formula is:
DSO = Average Accounts Receivable ÷ Credit Sales × Number of Days
How manual processes affect DSO
DSO can rise when:
- Invoices are submitted late
- Supporting documents are missing
- Reminders depend on individual calendars
- Collectors do not know which invoices to prioritize
- Customer responses remain buried in email
- Disputes are not routed promptly
- Payments remain unapplied
A team may work harder while DSO continues increasing because effort is focused on already overdue invoices rather than preventing delinquency.
What the CFO should infer
Persistent or volatile DSO indicates that cash collection is not operating predictably. It can increase borrowing requirements, weaken cash forecasting and restrict investment capacity.
How Kapittx helps
Kapittx uses AI-driven collections, automated reminders, customer segmentation, payment-risk prioritization and structured dispute workflows to help finance teams reduce DSO. Its dashboards enable CFOs to monitor DSO by customer, segment, entity and aging category rather than relying only on a company-wide average.
2. Actual DSO Versus Best Possible DSO
Best Possible DSO considers current receivables and excludes overdue balances. Comparing it with actual DSO helps separate the effect of agreed credit terms from collection inefficiency. SAP notes that best possible DSO uses current receivables rather than total receivables.
DSO Gap = Actual DSO − Best Possible DSO
How inefficient tools affect the KPI
Spreadsheets may calculate overall DSO but rarely explain which customers, disputes or process failures created the gap. The team sees the outcome after it deteriorates.
What the CFO should infer
A widening gap indicates that the company is collecting materially later than its contractual position should permit. This is a stronger automation-readiness signal than DSO alone.
How Kapittx helps
Kapittx allows finance teams to trace the DSO gap to specific invoices, overdue customers, disputed balances and missed follow-ups—turning a lagging KPI into an actionable worklist.
3. Collection Effectiveness Index
The Collection Effectiveness Index, or CEI, measures how much of the receivables available for collection during a period was actually collected.
A commonly used formulation is:
CEI = (Beginning AR + Credit Sales − Ending Total AR) ÷ (Beginning AR + Credit Sales − Ending Current AR) × 100
How manual collection affects CEI
Manual teams may apply the same reminder cadence to every customer. High-value, high-risk or broken-promise accounts can receive the same attention as low-risk customers likely to pay without intervention.
This increases activity without improving collection effectiveness.
What the CFO should infer
If CEI falls while collection calls and emails increase, the operating model is consuming more effort for less cash.
How Kapittx helps
AI accounts receivable technology can segment customers, analyze payment behaviour and prioritize collection actions based on value, risk, aging and expected payment probability.
4. Overdue Receivables Percentage
This KPI measures the proportion of open receivables that has passed its due date.
Overdue Receivables % = Overdue AR ÷ Total Open AR × 100
SAP similarly defines overdue-receivables status as overdue amounts divided by total open receivables.
How manual processes affect it
Invoices frequently become overdue because no action occurred before the due date. Static reports tell collectors what is already late but may not identify which current invoices are likely to become delinquent.
What the CFO should infer
A rising overdue percentage signals deteriorating working capital quality. The organization may be reporting revenue growth without converting that growth into cash at the same rate.
How Kapittx helps
Kapittx supports pre-due reminders, customer-specific collection strategies and predictive prioritization, helping AR teams intervene before an invoice enters an overdue bucket.
5. Aging Concentration and 90+ Day Receivables
An aging report groups receivables by how long they have remained unpaid—for example, current, 1–30, 31–60, 61–90 and more than 90 days past due.
A particularly useful KPI is:
90+ Day AR % = Receivables Over 90 Days ÷ Total AR × 100
How inefficient tools affect aging
Collectors working from spreadsheets may focus on familiar customers, largest invoices or the oldest balance. Smaller exceptions, missing documents and unresolved disputes remain untouched until they become severely aged.
What the CFO should infer
Growth in older buckets raises collection risk, increases the possibility of bad-debt provisions and may indicate that the escalation process is ineffective.
The CFO should not only ask, “How much is over 90 days?” but also:
- Why did these balances reach 90 days?
- When was the last meaningful customer interaction?
- How much is disputed?
- How much has no identified owner?
- Which balances remain collectible?
How Kapittx helps
Kapittx provides invoice-level aging visibility, automated escalations and reason-based segmentation so that AR teams can distinguish genuine credit risk from documentation, deduction, dispute and payment-application problems.
6. Accounts Receivable Turnover Ratio
The Accounts Receivable Turnover Ratio measures how efficiently the company converts credit sales into cash.
AR Turnover Ratio = Net Credit Sales ÷ Average Accounts Receivable
Oracle explains that a low turnover ratio can indicate an opportunity to improve collection performance.
How manual AR affects turnover
As invoice volumes grow, manual follow-ups become inconsistent. Cash collection fails to scale with sales, average receivables rise and turnover declines.
What the CFO should infer
A falling ratio may show that revenue growth is consuming working capital. The business is selling more but recycling cash more slowly.
However, the ratio must be interpreted alongside credit policy, customer mix, seasonality and sales growth. A single universal target is rarely appropriate.
How Kapittx helps
Kapittx connects customer-level payment behaviour with collection prioritization, enabling finance teams to address the accounts exerting the greatest pressure on receivable turnover.
7. Cash Application Cycle Time and Unapplied Cash
Cash application cycle time measures how long it takes to identify a receipt, match it with invoices and post it to the ERP.
Useful supporting metrics include:
- Percentage of cash applied on the day of receipt
- Value and count of unapplied cash
- Straight-through cash application rate
- Manual exception rate
- Average time to clear an unidentified receipt
How manual processing affects the KPI
AR teams may need to search remittance emails, bank references, lockbox files and customer portals. Combined payments, short payments and missing remittance information make matching slower.
The bank contains the cash, but the customer ledger still shows the invoice as open.
What the CFO should infer
High unapplied cash means the company cannot fully trust its aging, customer exposure or collection forecast. It can also lead to unnecessary customer follow-up and delays in releasing blocked orders.
How Kapittx helps
Kapittx’s AI Cash Application Agent matches invoices, remittance information and bank transactions, handles exceptions and supports ERP posting. This improves reconciliation accuracy and accelerates invoice closure.
8. Dispute Rate and Resolution Time
Dispute rate measures the proportion of receivables affected by disputes, deductions or claims.
Dispute Rate = Disputed AR ÷ Total AR × 100
Dispute resolution time measures the average number of days between dispute creation and closure.
How inefficient tools affect disputes
Disputes are often tracked in email threads and spreadsheets. AR identifies the problem, but Sales, Logistics, Customer Service or Tax must resolve it. Without ownership, reason codes and deadlines, invoices remain blocked.
What the CFO should infer
A high dispute balance is cash that has been invoiced but is not yet economically collectible. Long resolution times can reveal upstream order-to-cash problems such as pricing errors, missing proof of delivery, incorrect taxes or incomplete documentation.
How Kapittx helps
Kapittx categorizes disputes, assigns ownership, tracks aging and creates escalation workflows. This gives the CFO visibility into both the value of disputed cash and the operational cause.
9. Promise-to-Pay Kept Rate
A promise-to-pay, or PTP, records a customer’s commitment to pay a specific amount by a specific date.
PTP Kept Rate = Promises Honoured ÷ Promises Due × 100
How manual collection affects the KPI
Promises may be stored in collector notes, email or individual spreadsheets. Missed commitments are not always identified immediately, and different collectors may repeatedly accept new dates without escalation.
What the CFO should infer
A low PTP kept rate indicates weak collection predictability. It also shows that the cash forecast may be based on customer statements that are not behaviourally reliable.
How Kapittx helps
Kapittx captures payment commitments, monitors due dates and escalates broken promises. Historical PTP behaviour can also inform collection prioritization and probability-weighted cash forecasts.
10. Collector Productivity and Automation Rate
Traditional productivity metrics include:
- Cash collected per collector
- Accounts or invoices managed per collector
- Follow-up actions completed
- Cost to collect
- Time spent on administrative work
For automation readiness, these should be combined with:
Automation Rate = Transactions Completed Without Manual Intervention ÷ Total Eligible Transactions × 100
How inefficient tools affect productivity
A high activity count can hide low-value work. Collectors may spend significant time:
- Downloading aging reports
- Preparing customer statements
- Drafting routine reminders
- Searching for remittances
- Updating spreadsheets
- Recording customer responses
- Preparing management reports
What the CFO should infer
If revenue, invoice volume and AR headcount rise at similar rates, the process is not scaling. The company has digitized records but not automated decisions or actions.
How Kapittx helps
Kapittx automates reminders, captures customer responses, prioritizes work, applies cash and updates collection status. The team can then focus on negotiations, strategic accounts, complex disputes and customer relationships.
How Can You Measure AR Automation Readiness?
CFOs can use a simple four-stage assessment.
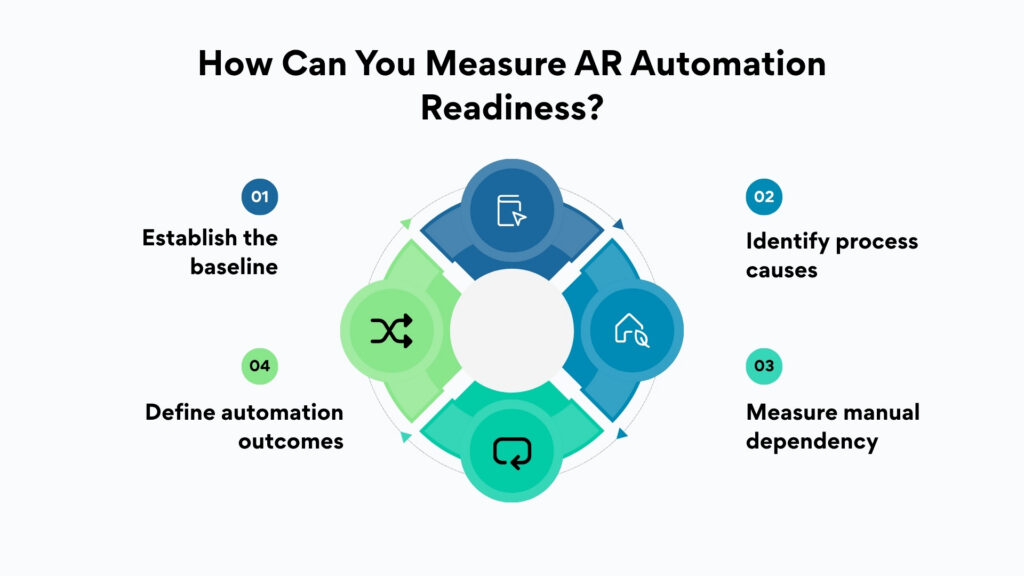
Stage 1: Establish the baseline
Measure the ten Accounts Receivable KPIs across at least six to twelve months. Segment results by customer, business unit, entity, region and collector.
Stage 2: Identify process causes
Determine whether poor performance results from customer risk, invoice quality, missing documents, inconsistent follow-up, disputes, cash application or inaccurate ERP data.
Stage 3: Measure manual dependency
Calculate how much team capacity is consumed by repetitive activities. High manual effort combined with worsening outcomes creates a strong case for Invoice-to-Cash Automation.
Stage 4: Define automation outcomes
Set measurable objectives, such as:
- Reduce DSO by a defined number of days
- Reduce 90+ day receivables
- Increase same-day cash application
- Lower unapplied cash
- Improve PTP adherence
- Shorten dispute resolution time
- Increase accounts managed per collector
- Improve forecast accuracy
Readiness should lead to an outcome-based implementation—not a technology purchase without measurable success criteria.
What AR Readiness Means to the CFO and the Organization
For the CFO, AR automation readiness signals an opportunity for Working Capital Optimization.
A reduction in receivable days releases cash without requiring additional revenue, external funding or cuts to strategic spending. Faster cash application improves reporting accuracy. Earlier dispute detection strengthens cross-functional accountability. Better customer-level forecasts improve liquidity planning.
For the wider organization, the impact includes:
- Fewer inappropriate collection messages to customers
- Faster release of credit-blocked orders
- Better coordination between Finance, Sales and Customer Service
- Lower bad-debt exposure
- More reliable cash forecasts
- Reduced dependence on individual collectors
- Ability to scale without proportionate AR headcount
AR readiness is therefore not solely an AR transformation question. It affects customer experience, revenue continuity, capital allocation and enterprise resilience.
How Kapittx Helps Improve AR Automation KPIs
Kapittx adds an AI-powered system of action over existing ERPs such as SAP, NetSuite, Microsoft Dynamics, QuickBooks and Tally.
Its AI agents support the invoice-to-cash process through:
- Intelligent collection prioritization
- Automated and personalized payment reminders
- Customer-response interpretation
- Promise-to-pay tracking
- Invoice, remittance and bank reconciliation
- AI-powered cash application
- Dispute and deduction management
- Exception routing and escalation
- ERP synchronization and posting
- Real-time dashboards and predictive analytics
Kapittx does not simply display Accounts Receivable Metrics. It helps finance teams act on the underlying transactions affecting those metrics.
An ERP can report which invoices are open. Kapittx helps determine which invoices require attention, what action should occur next and whether that action produced the intended cash outcome.
Conclusion: Your KPIs Already Contain the Automation Business Case
The question is not whether every AR KPI is poor. The more important question is whether performance increasingly depends on manual effort that cannot scale.
Rising DSO, declining collection effectiveness, growing overdue balances, unapplied cash, slow disputes and low collector productivity are connected symptoms. Together, they show that the company’s invoice-to-cash process has outgrown spreadsheets, generic workflows or inefficient AR tools.
The right AR Automation KPIs help CFOs quantify the problem, prioritize the implementation and measure the value created.
Automation readiness begins when finance stops asking, “How many reminders did we send?” and starts asking, “Which actions converted receivables into cash?”
FAQs
What KPIs indicate that a company needs AR automation?
The strongest indicators include rising DSO, a widening actual-versus-best-possible DSO gap, declining CEI, increasing overdue receivables, high unapplied cash, slow dispute resolution and rising collection costs.
How can I measure AR automation readiness?
Establish a six-to-twelve-month KPI baseline, identify process bottlenecks, calculate manual effort and determine whether current tools can scale with customer and invoice growth.
How do you evaluate accounts receivable performance?
Evaluate cash outcomes, receivable quality, process speed and team productivity. DSO alone is insufficient; it should be combined with CEI, aging, turnover, cash application, disputes and PTP performance.
What is a good DSO?
A good DSO depends on contractual payment terms, industry, customer mix and geography. The most useful comparison is between actual DSO, best possible DSO and the company’s historical trend.
What is the Accounts Receivable Turnover Ratio?
The Accounts Receivable Turnover Ratio divides net credit sales by average accounts receivable. It measures how efficiently receivables are converted into cash.
How does AR automation reduce DSO?
AR automation reduces delays through timely invoice delivery, automated reminders, predictive prioritization, faster dispute resolution and accurate cash application.
Why is unapplied cash an important AR KPI?
Unapplied cash makes customer balances and aging reports unreliable. It can cause duplicate collection efforts, incorrect credit exposure and inaccurate cash forecasting.
Which KPI measures collection-team productivity?
Cash collected per collector, accounts managed per collector, cost to collect and the percentage of transactions completed without manual intervention collectively measure productivity.
How does AI accounts receivable differ from workflow automation?
Workflow automation follows predefined steps. AI accounts receivable can interpret customer responses, identify payment risk, recommend actions, match complex payments and adapt prioritization using transaction context.
How should CFOs measure the ROI of AR automation?
Measure improvements in DSO, overdue AR, unapplied cash, dispute resolution, automation rate, collection cost, forecast accuracy and AR capacity before and after implementation.
